Investors
search website
Enterprise
Demo Store
TRY-ON
breadcrumb iconBlogbreadcrumb iconGeneralbreadcrumb icon
Facial Thirds Detector: The Ultimate Guide 2026
Face Technology

Facial Thirds Detector: The Ultimate Guide 2026

Aug 25, 2026 · 3 minutes read
Facial Thirds Detector: The Ultimate Guide 2026
Every face gets sliced into three. Hairline to brow. Brow to the base of the nose. Base of the nose to the bottom of the chin. Artists have been drawing those bands since the Renaissance, surgeons still sketch them before a consult, and now an AI model can measure them from a selfie in under a second.
That tool has a name: the facial thirds detector. And in 2026 it is quietly showing up everywhere, inside looksmaxxing apps, orthodontic intake forms, virtual try-on flows, and beauty advisor tablets at the cosmetics counter.

This guide covers what a facial thirds detector actually measures, how the math works under the hood, how accurate the results really are (with the failure modes nobody mentions), what a "good" result looks like across different populations, and how brands plug the technology into their own products.

What Is a Facial Thirds Detector?

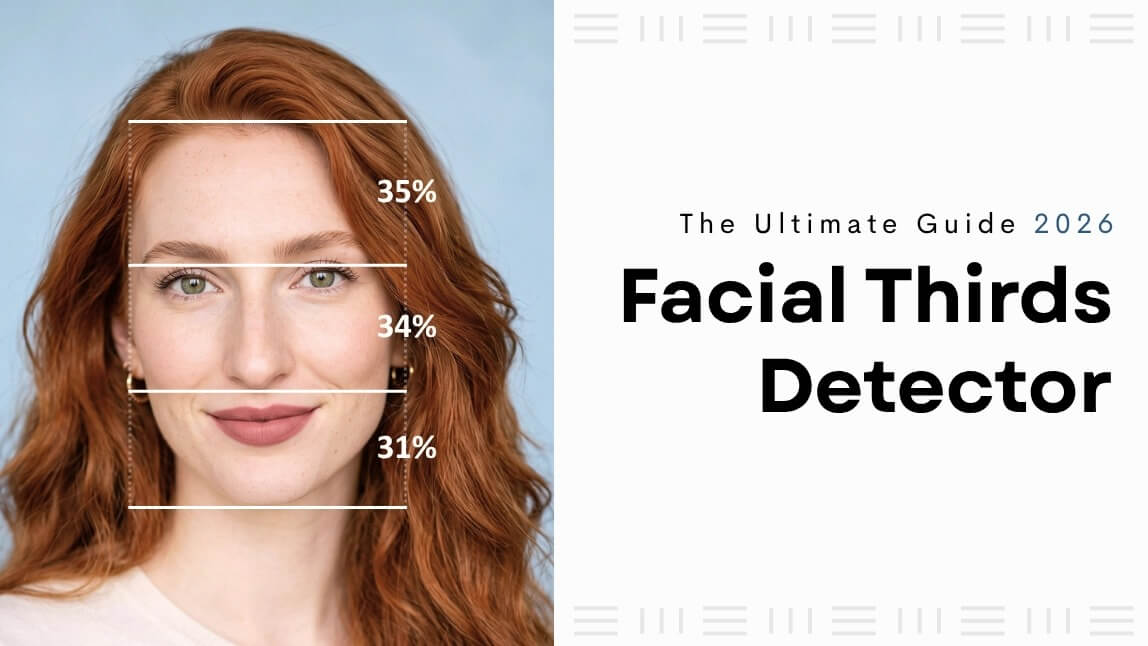
A facial thirds detector is a computer vision tool that divides a face into three vertical sections and measures the height of each one, then reports how close those sections are to being equal. Classical proportion theory calls the balanced result 1 : 1 : 1. Most detectors return either three percentages that add up to 100, or a ratio comparing the middle third to the lower third.

The three sections are:

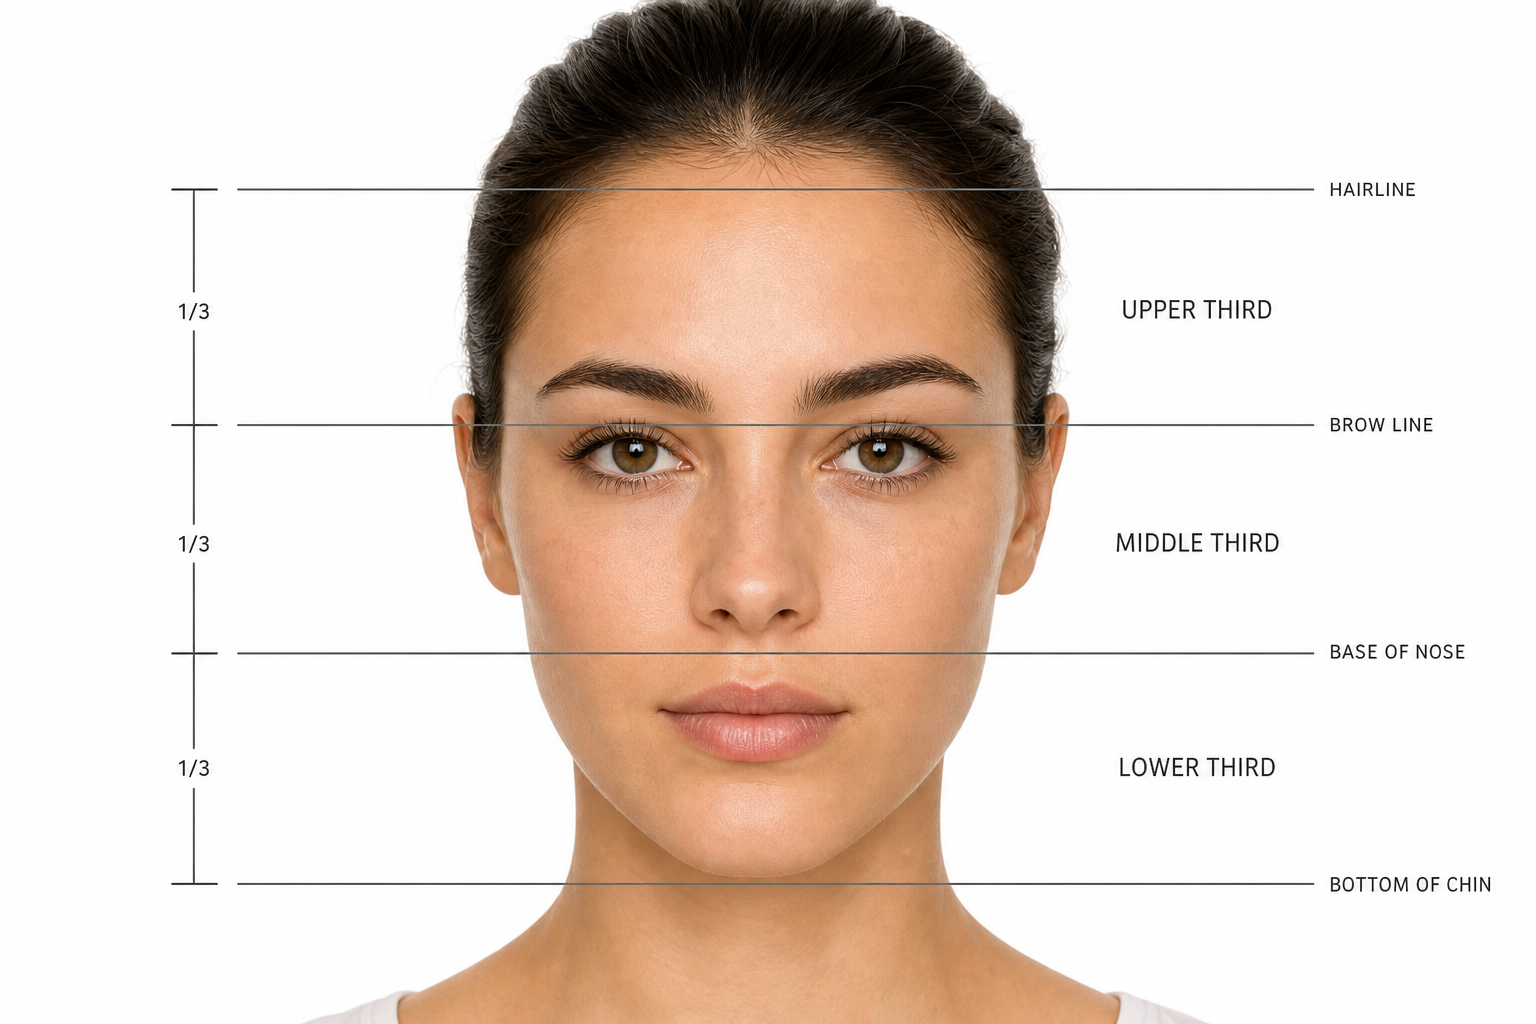
  • Upper third: from the hairline (trichion) down to the line between the brows (glabella)
  • Middle third: from the glabella down to the base of the nose (subnasale)
  • Lower third: from the subnasale down to the bottom of the chin (menton)


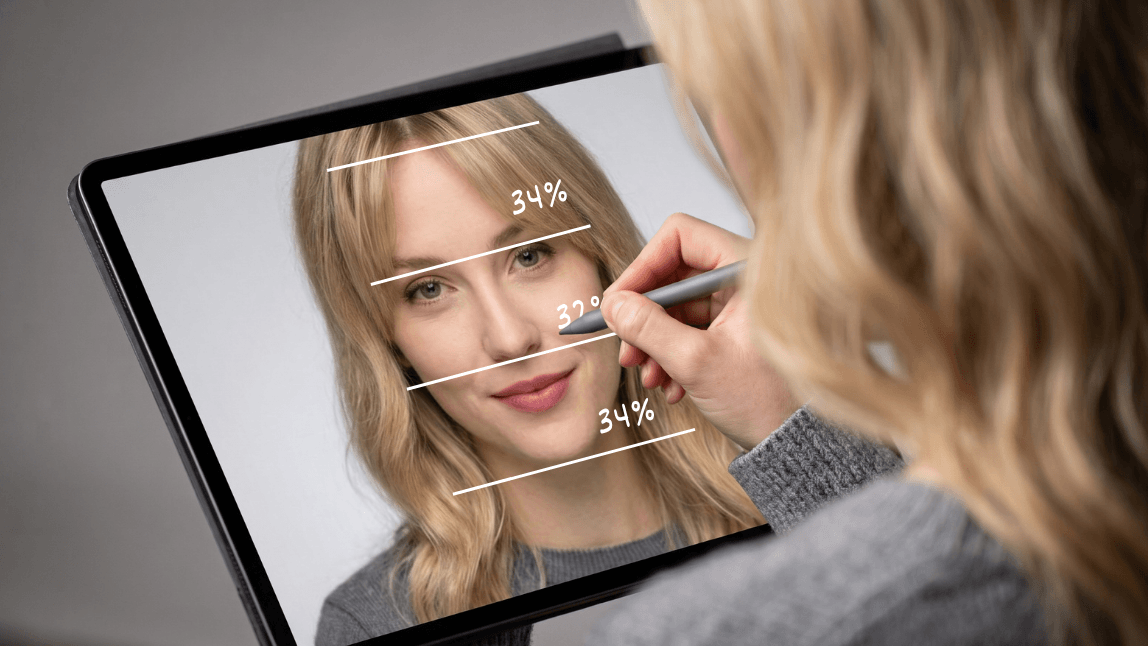
Diagram showing a face divided into equal upper, middle and lower thirds


A manual version of this measurement takes a ruler, a printed photo, and about five minutes. A facial thirds detector does the same thing with facial detection models, and it does it the same way every time, which is the part that actually matters. Consistency is what turns a party trick into something a brand can build a product on.


Where Did the 1 : 1 : 1 Rule Come From?

The rule is older than photography. Renaissance artists working from classical canons treated the equal-thirds face as a construction guide, a way to draw a plausible head without a model in the room. Leonardo da Vinci's proportion studies use the same divisions. The convention survived into 19th century academic drawing manuals, then into 20th century plastic surgery textbooks, where it became a planning shorthand rather than an artistic one.

draw a plausible head without a model in the room

Here is the part most articles skip. The 1 : 1 : 1 canon was never a measurement of real populations. It was a drawing rule. When anthropometrists finally went and measured thousands of actual faces, the equal-thirds face turned out to be uncommon.

Leslie Farkas and colleagues documented this in the 1980s, and every large study since has repeated the finding: real faces cluster near equal thirds without landing on it.

So treat 1 : 1 : 1 as a reference line, not a target. A facial thirds detector that scores you against it is telling you how far you sit from an idealized drawing convention, which is interesting, and is not a verdict on your face.

(Source: 1, 2, 3, 4, 5, 6, 7, 8)

How Does a Facial Thirds Detector Actually Work?

Four stages, running in sequence, usually in well under a second on a modern phone.

Stage 1: Face detection and alignment

The model first finds a face in the frame and estimates its pose in three dimensions: yaw (turned left or right), pitch (tilted up or down), and roll (tilted sideways).

Pitch is the dangerous one for this particular measurement, because tilting the chin up compresses the lower third and tilting it down stretches it.

Good detectors either correct for pose mathematically or reject the photo and ask for a straighter one.

Stage 2: Reference line extraction

Next the model locates the four horizontal reference lines it needs: trichion, glabella, subnasale, menton. Three of those four are anatomically well defined and easy for a model to hit consistently. The fourth, trichion, is not, and we come back to that in the accuracy section because it is the single largest source of variance in facial thirds output.

Stage 3: Normalization and ratio math

Raw pixel distances are useless on their own, since they change with camera distance and image resolution. The detector converts them into scale-free ratios. Two conventions dominate:

  • Percentage split: each third is expressed as a share of total face height, so a perfectly balanced result reads 33.3 / 33.3 / 33.3
  • Middle to lower ratio: middle third height divided by lower third height, where 1.00 is balanced. This one is standard in clinical literature because the hairline is excluded, which removes the trichion problem entirely

Stage 4: Scoring and interpretation

Finally the numbers get turned into something readable. A consumer app might return a balance score out of 100. A clinical or B2B tool is more likely to return the raw ratios plus a comparison against population reference ranges, which is far more useful and much harder to misread.

How Do You Measure Facial Thirds Manually?

Measure Facial Thirds Manually

  1. Shoot a proper photo. Camera at eye level, roughly an arm and a half away, face straight to the lens, neutral expression with lips together but not pressed, hair fully off the forehead, no glasses, even front lighting.
  2. Mark four lines. On the photo, draw horizontal lines at the hairline, the point between the brows, the base of the nose where it meets the upper lip, and the lowest point of the chin.
  3. Measure the three gaps in millimeters or pixels. Call them U, M and L.
  4. Compute the shares. Total equals U plus M plus L. Each third's percentage is its own value divided by the total, times 100.
  5. Compute the clinical ratio. Divide M by L. This is the number to compare against published reference ranges.

Example. A face measures U 62 mm, M 68 mm, L 66 mm. Total is 196 mm, so the split is 31.6 / 34.7 / 33.7 percent, and the middle to lower ratio is 68 divided by 66, which is 1.03. That sits inside the typical range, with a slightly dominant midface.

What Counts as a Good Facial Thirds Result?

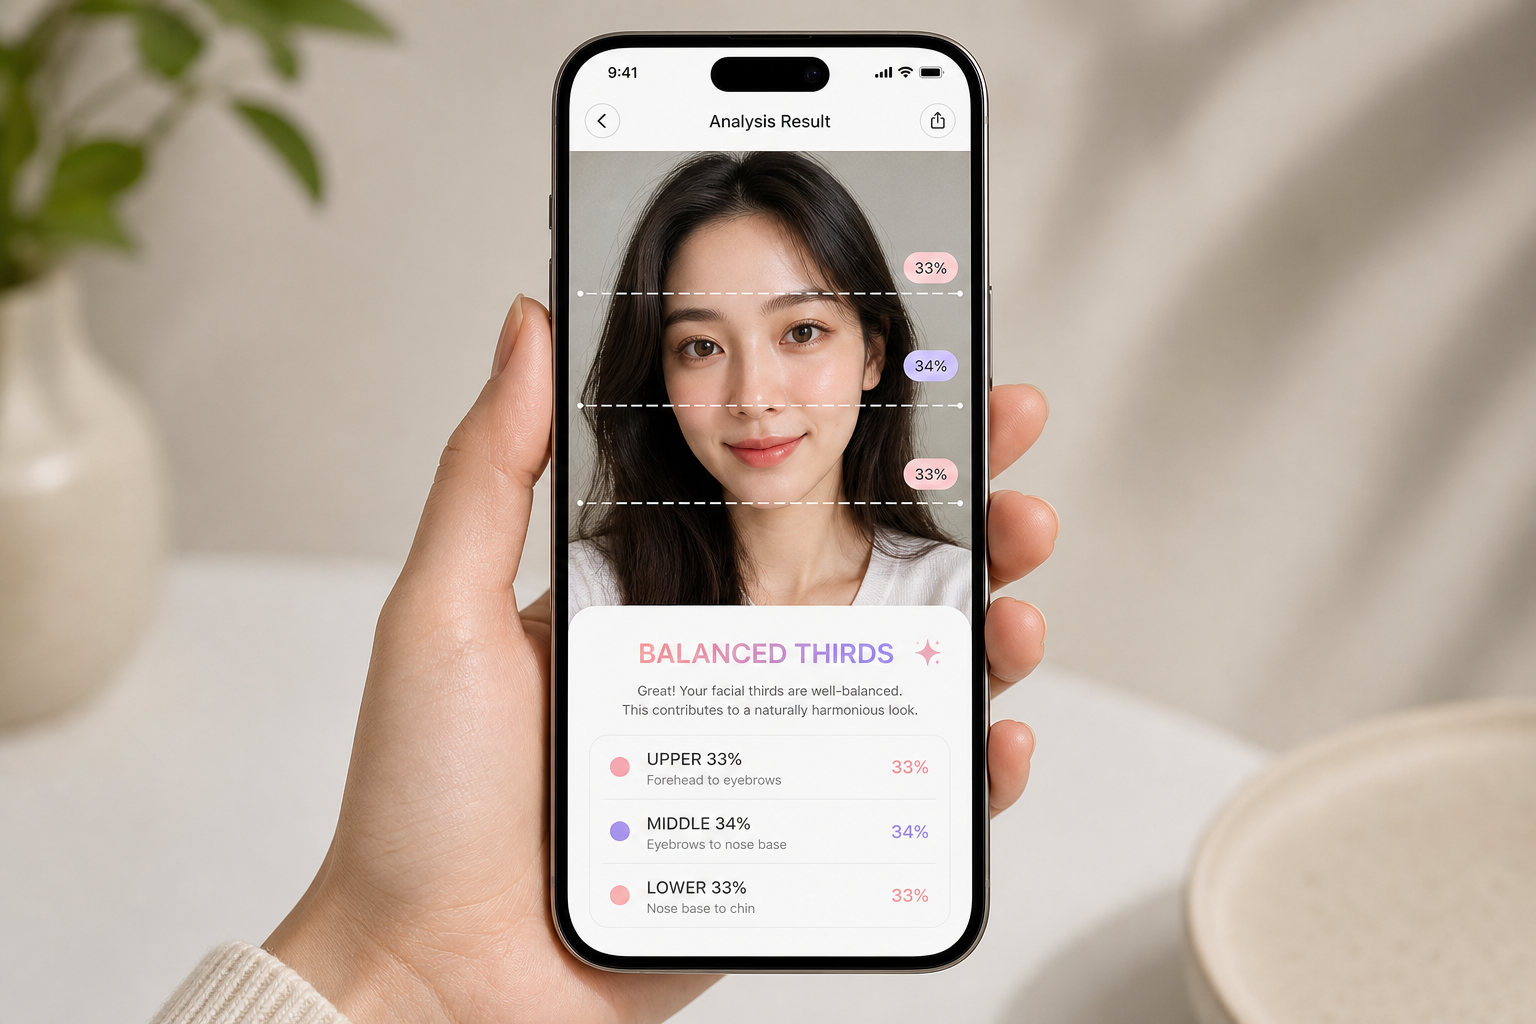
Facial thirds detector app showing upper, middle and lower third percentages

Population data is the honest answer here, and it varies meaningfully by sex and ancestry. These are middle third to lower third ratios reported in the anthropometric literature:

Population groupTypical middle : lower ratioReference
Caucasian men1.00 to 1.02Farkas et al., 1985
Caucasian womenapproximately 1.00Farkas et al., 1985
African American adults0.93 to 0.97Choe et al., 2000
East Asian adults0.97 to 1.02Zheng et al., 2022
Arabian Peninsula adults0.88 to 0.93Al Taki et al., 2015
General working range0.95 to 1.05Pooled clinical norms

Read that table twice before you read your own score. The spread between the highest and lowest group averages is larger than the deviation most individuals show from their own group's mean. A detector that scores every face against a single universal ideal will systematically penalize entire populations, which is a product design failure, not a facial one.

The lower third has its own internal split

Clinicians rarely stop at three bands. The lower third divides again: from the base of the nose to the lip line should be roughly one third of it, and from the lip line to the chin roughly two thirds. That 1 : 2 relationship is often more diagnostically interesting than the outer thirds, because it responds to dental occlusion, jaw position, and age related changes in a way the upper third does not.


How Accurate Is a Facial Thirds Detector?

Accurate enough to be useful, and less accurate than the two decimal places on screen imply. Four things drive the error.

The hairline problem

Trichion is a soft-tissue convention, not a bone. It migrates with age, it differs by sex, it is ambiguous on a receding or very dense hairline, and it disappears entirely under a fringe or a hat. Every study of upper third measurement reports wider variance than the other two bands. 

Perspective distortion

Shoot a selfie at arm's length with a wide phone lens and the features closest to the camera get magnified. Nose forward, forehead and chin falling away. The result is a compressed upper and lower third and an inflated middle. Backing up and zooming in, or using the rear camera at a normal distance, changes the same person's numbers by several percentage points. 

Pose and expression

A few degrees of chin lift measurably shrinks the lower third. A slight smile shortens it too. Jaw clenching moves the menton. This is why serious tools enforce a neutral expression and a level gaze before they will return a result.

Test and retest reliability

The practical question is not "is one measurement correct" but "does the same face produce the same number twice." Run yourself through any detector five times with different photos and you will see the spread. A well built tool keeps that spread tight because it corrects for pose and rejects unusable input. A poorly built one hands back a confident number from a bad photo.

Perfect Corp's face technology has been trained and tuned across a wide range of ages, skin tones, and face structures precisely to keep that spread small, which is what its 800+ brand partners are actually buying. You can see how the output behaves in the AI Facial Thirds Calculator.

Facial Thirds vs Facial Fifths vs Golden Ratio: What Is the Difference?

These three get used interchangeably online and they measure completely different things.

MethodAxisWhat it measuresBalanced resultBest used for
Facial thirdsVerticalHeight of three horizontal bands1 : 1 : 1Midface length, chin and jaw height, aging
Facial fifthsHorizontalWidth in five eye-width columns1 : 1 : 1 : 1 : 1Eye spacing, face width, nose and mouth width
Golden ratioBothMultiple distances scored against 1.618Composite scoreA single headline number, weakest evidence base

If you only run one, run thirds. It is the measurement with the deepest clinical literature behind it and the clearest link to things people actually notice, like a long lower face or a short midface. For the wider picture of how vertical proportions interact, our breakdown of the midface ratio goes a level deeper on the middle band specifically.

What Can Actually Change Your Facial Thirds?

Honest version, split into three buckets.

Changes the measurement without changing your face: hairstyle and fringe (moves the apparent hairline), brow shaping and brow position, camera distance and angle, posture and head carriage, facial hair on the lower third.

Changes your face slowly and modestly: body fat levels affecting lower face fullness, age related soft tissue and bone remodeling (the lower third generally lengthens through adulthood then loses vertical height with dental wear and bone loss), long term orthodontic treatment in a growing patient, posture driven changes in jaw position over years.

Changes your face structurally: orthognathic surgery, genioplasty, rhinoplasty affecting the subnasale position, hairline lowering or transplant surgery, dermal filler placement in the chin or midface. All of these are clinical decisions with clinical risks and belong in a consultation, not in an app score.

How Do Brands Use Facial Thirds Detection?

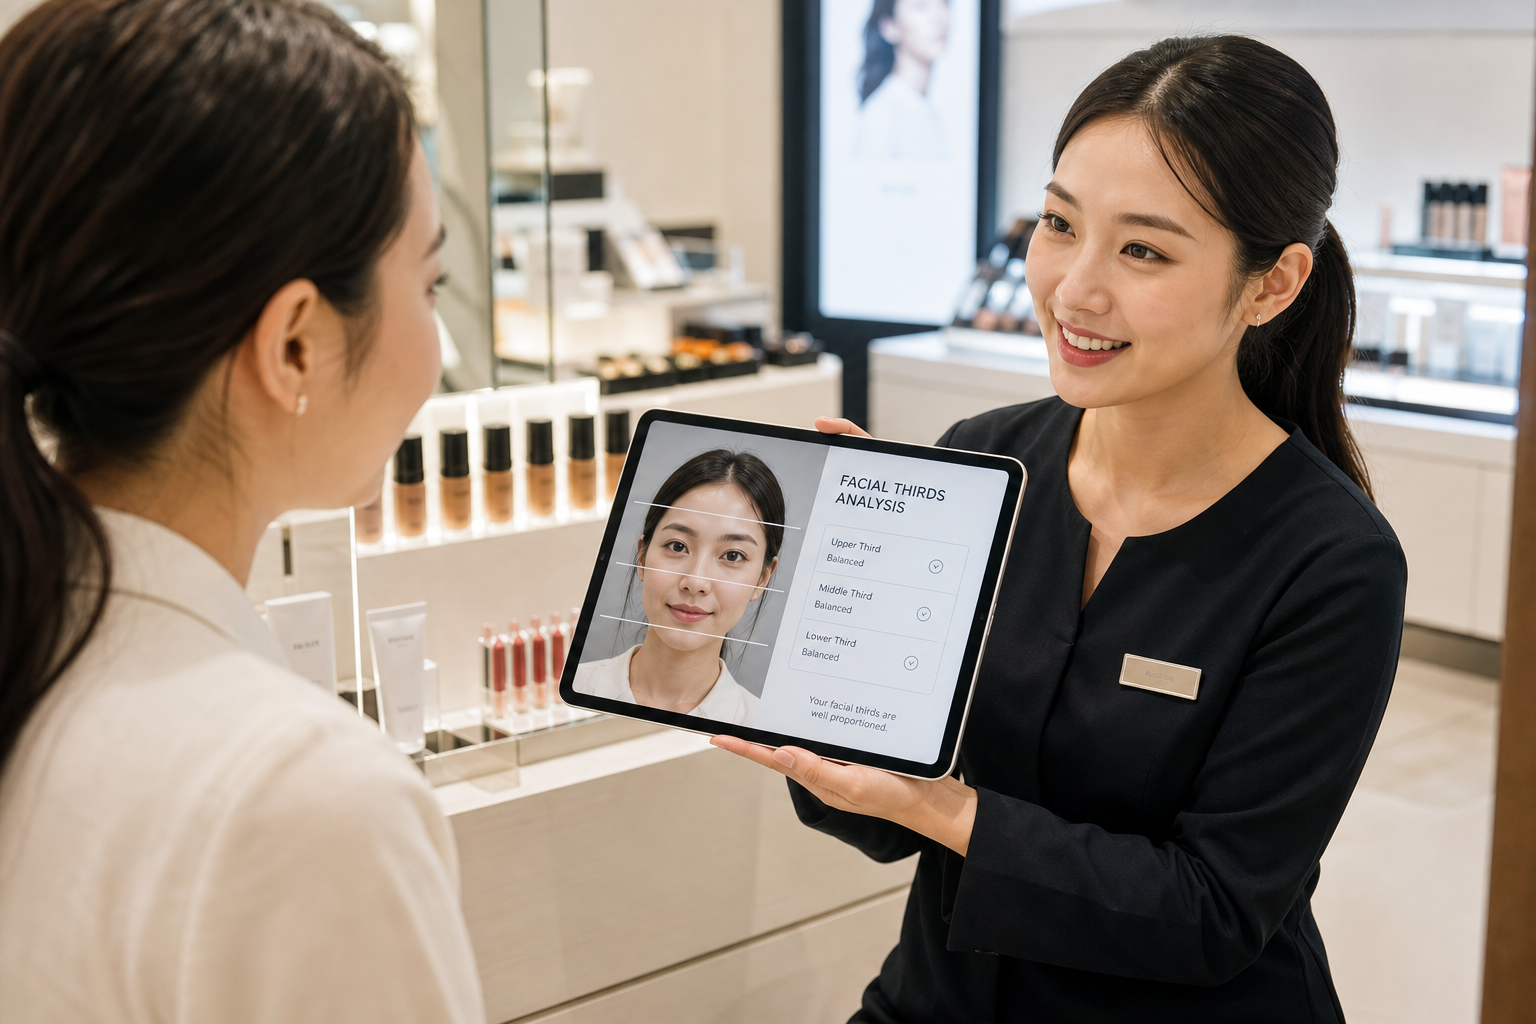
Beauty advisor showing a customer a facial thirds analysis on a tablet

This is where the measurement stops being trivia and starts being infrastructure. Facial proportion output feeds four commercial workflows.

Makeup personalization

Contour and highlight placement is proportion driven. A long lower third calls for different bronzer placement than a dominant midface. Brands that pipe proportion data into a shade and technique recommender turn a generic tutorial into a personalized one, and the conversion difference on that is not subtle.

Hair and fringe recommendation

A fringe shortens the visible upper third, which is exactly why stylists recommend it for certain proportions and not others. Automating that judgment inside a virtual try-on means the recommendations lead with the styles most likely to suit, rather than making the customer scroll through fifty.

Aesthetic consultation support

Clinics use proportion output to structure the conversation and to document a baseline. Objective numbers before treatment and after treatment are better than memory, and they set expectations with a patient far more effectively than a mirror does.

Eyewear, jewelry and accessory fit

Frame depth relative to the middle third, earring length relative to the lower third. Any product that sits on a face has a proportion logic behind what suits, and most catalogs currently ignore it. You can see this class of face analysis running live across the Perfect Corp showcase demos.

How Do You Choose a Facial Thirds Detector?

Whether you are picking a tool to try or a vendor to build on, the same seven questions separate the credible from the decorative.

  1. Does it show the raw ratios, or only a score? A score with no underlying numbers cannot be verified or compared.
  2. Does it report the middle to lower ratio? If it only reports three percentages, it is fully exposed to the hairline problem.
  3. Does it correct for or reject bad head pose? Silent acceptance of a tilted photo means silently wrong output.
  4. Does it compare against population appropriate ranges? A single universal ideal is a red flag.
  5. Is it stable across repeat photos? Test it. Five photos, same person, same session.
  6. Where does the photo go? On-device or transient processing, clear retention policy, no training on user images without consent.
  7. Can it scale? For commercial use, that means documented latency, an SDK or API, and a support path when something breaks at volume.

Free consumer toolEnterprise API or SDK
OutputScore, sometimes ratiosFull structured data
Pose correctionRarelyStandard
Population reference dataAlmost neverExpected
Repeat stabilityVariableTested and documented
Data handlingOften unclearContractual, auditable
IntegrationNone, it is a web pageWeb, iOS, Android, API
Best forCuriosityProducts people pay for

Frequently Asked Questions About Facial Thirds Detectors

What is the ideal facial thirds ratio?

The classical ideal is 1 : 1 : 1, meaning three equal bands. In real populations the middle to lower ratio typically falls between 0.95 and 1.05, and group averages shift with sex and ancestry, so the classical figure is best treated as a reference rather than a target.

Are facial thirds supposed to be equal?

No. Perfectly equal thirds are uncommon in measured populations. Faces cluster near equal without landing on it, and small deviations are the norm rather than a flaw.

How accurate is a facial thirds detector?

A well built detector is highly repeatable on a good photo. Accuracy drops sharply with camera distance, head tilt, a smiling expression, or a covered hairline. The middle to lower ratio is the most reliable output because it does not depend on locating the hairline.

Can I measure facial thirds at home without an app?

Yes. Take a straight-on photo, mark the hairline, brow line, nose base and chin, measure the three gaps, then divide each by the total. Divide the middle gap by the lower gap for the clinically useful ratio.

What does a long lower third mean?

A lower third that takes up noticeably more than a third of face height usually reflects chin height or jaw position, and sometimes dental factors. It reads as a longer, more angular lower face. It is a description of structure, not a defect.

Can you change your facial thirds?

Cosmetically yes, structurally only through clinical intervention. Hair, brows and posture change the measurement. Surgery, orthodontics and fillers change the underlying face. Exercises and chewing routines do not move bone.

Do facial thirds differ by ethnicity?

Yes, and measurably. Published averages for the middle to lower ratio range from roughly 0.88 in some Arabian Peninsula samples to just over 1.02 in some Caucasian male samples. Any detector scoring all faces against one ideal will misread that variation as imbalance.

Is facial thirds the same as the golden ratio face test?

No. Facial thirds measures three vertical heights against each other. Golden ratio tests score many distances against 1.618 and roll them into one composite number. Thirds has the stronger clinical grounding of the two.

Why do two apps give me different facial thirds results?

Usually the photo, not the app. Different camera distance, head tilt or hairline visibility between the two captures will move the numbers. Different reference ranges and different scoring formulas account for the rest.

Is there a free facial thirds detector?

Yes, several, including Perfect Corp's own AI Facial Thirds Calculator. Free consumer tools are fine for curiosity. If the output is going into a product, look for an API with documented stability and clear data handling instead.

Does age change your facial thirds?

It does. The lower third generally lengthens through adolescence and early adulthood, then loses vertical height later in life with dental wear and bone resorption. The hairline shift with age also changes the upper third measurement.

What is the ideal split inside the lower third?

Roughly 1 : 2. The distance from the base of the nose to the lip line takes about one third of the lower band, and the lip line to the chin takes about two thirds. Clinicians often find this internal split more informative than the outer thirds.

# Platform Support
Popular
Face Technology
Facial Analysis: What, Why, How Brands Leverage It
AR Accessories
What Glasses Fit Your Face Shape? Try AI Online & Get…
AI/AR Makeup
AI Face Shape Analyzer for Contour & Makeup [Try It O…
By using the website, you agree to our use of cookies. Head to our cookie statement to learn more about cookies and manage cookies on this website.